I: Business Overview
1. Executive Summary
- MapmyIndia is essentially the “Intel Inside” for location data in India. Founded in 1995, it has transitioned from a niche data surveyor into a full-stack MaaS (Map as a service), SaaS (Software as a service), and PaaS (Platform as a service) provider. The company operates a B2B and B2B2C model, serving as a critical infrastructure layer for over 2,000 enterprise customers, including 80% of India’s automotive OEMs with connected solutions. Its revenue used to be bifurcated into two market segments: Automotive & Mobility Tech (A&M) and Consumer Tech & Enterprise Digital Transformation (C&E). In latest conference call, they decided to revise their segmental reporting to be more aligned with their target markets: Auto, Government, and Corporate.
- Financially, the business is defined by high entry barriers and high operating leverage. Because the map data is created once and licensed repeatedly, the Map-led business generates EBITDA margins exceeding 50%. As of May 2026, the company has successfully survived a period of “consolidation and resilience” (FY26) and is entering FY27 with a record-high open order book of ₹1,754 Cr.
- While the company is popularly known as MapmyIndia in the domestic market, it adopted the Mappls brand for its international expansion and certain product contexts.
2. What’s Interesting
- The Indigeneity Moat: Under the 2021 Geospatial Guidelines and the 2022 Deregulation Bill, MapmyIndia enjoys a “home field” advantage. Foreign entities are restricted from conducting granular ground surveys, making the company the preferred choice for sensitive defence and government projects.
- Data Superiority and Flywheel Effect: They have been building India’s map for 25+ years, covering 99% of the road network and 3 crore+ places. Every additional user (whether an Ola driver or a Hyundai car) generates signals that improve the map data via AI-assisted feedback loops, making the asset increasingly difficult for new entrants to replicate.
- Asset-Light IoT “J-Curve”: While IoT hardware was initially viewed as a low-margin drag, FY26 proved the management’s “J-curve” thesis. By seeding hardware, they are now reaping high-margin SaaS subscription revenue, which pushed IoT EBITDA margins to a “stellar” 33% in Q4 FY26.
- Capital Efficiency: The business has raised only ₹124 crores in its entire pre-IPO history, proving it can fund explosive growth through internal accruals while maintaining a ₹600 Cr+ net cash balance.
3. Future Monitorable
- AI and Geo-LLMs: The launch of Geo-Verify and Geo-LLMs marks a shift from providing “points on a map” to “meaning from maps.” Success here in the BFSI sector (deciphering complex Indian addresses) will be a primary driver of enterprise SaaS growth.
- Defence and Mappls DT: The conversion rate of defence contracts handled by the new subsidiary, Mappls DT, is critical. These are lumpy but massive contracts that provide long-term annuity revenue.
- International Execution: The Southeast Asian Joint Venture (PT Terra Link) is the litmus test for whether their software stack is truly geography-agnostic. Higher ARPUs in international markets (2.5x to 3x vs India) could significantly re-rate the stock if they achieve scale.
- Software-Defined Vehicles (SDVs): As cars move toward ADAS and autonomous features, MapmyIndia’s N-CASE platform must become the standard OS for the vehicle cockpit to maintain its 80% market share against encroaching global tech giants.
4. Evolution
- 1995-2000 (The Pioneers): Rakesh and Rashmi Verma founded the firm, manually building India’s first digital map database long before GPS was a household term.
- 2004-2010 (Internet & Auto): Launched India’s first internet mapping portal (2004) and entered the Automotive OEM space (2007) with GPS navigation systems.
- 2011-2016 (IoT & Fleet): Forayed into GPS-based telematics and workforce automation, laying the groundwork for the modern IoT business.
- 2017-2021 (The Deep-Tech Pivot): Transitioned to AI-powered 4D/HD maps and Digital Map Twins. This culminated in the December 2021 IPO, which was subscribed 155x.
- 2022-2026 (Global & AI Era): Launched Mappls Global (200+ countries), expanded into Drones via Indrones, and operationalized the Mappls DT subsidiary for defence and government transformation.
5. Competitive Advantages: Platform lock-in
MapmyIndia’s moat has widened chronologically from data collection to platform lock-in:
- Early Mover Advantage (1995-2010): While others waited for satellite imagery, MapmyIndia spent 15 years on the ground, creating a “ground-truth” database that remains their core IP foundation.
- Vertical Integration (2011-2019): By controlling the full stack—from the map data to the tracking hardware and the software analytics—they mitigated pricing pressure that standalone hardware or software firms faced.
- Regulatory Barrier (2021-Present): The formalization of Geospatial Guidelines created a “regulatory wall,” effectively excluding foreign players from ground-level surveys and giving MapmyIndia a monopoly-like advantage in high-security government and defence sectors.
- Platform & Network Lock-in (Ongoing): With over 880 enterprise customers and 2,000+ served since inception, their SDKs are deeply embedded in the “pipes” of the Indian digital economy (PhonePe, HDFC, etc.), creating massive switching costs.
6. Industry Dynamics with Competitive Intensity
The geospatial industry has moved from a niche service into a “standard necessity” for the economy.
- Competitive Landscape: In the B2B space, the management dismisses “noises” from global players like Google. They argue that global players focus on B2C (advertising), whereas MapmyIndia wins on customization and SDK integration for B2B.
- Intensity Shift: Competition has intensified in the IoT and consumer space, but MapmyIndia has responded by “verticalizing” its solutions. Instead of selling generic maps, they sell “Quick-comm solutions” or “BFSI fraud detection,” which competitors struggle to match due to lack of local address-level depth.
- Future Dynamics: The industry is currently shifting toward Software-Defined Vehicles (SDVs) and Advanced Driver Assistance Systems (ADAS). Management identifies this as the next battlefield, where their early work in HD mapping and E-Horizon technology (predictive driver assistance) provides a 3- to 4-year lead over local entrants.
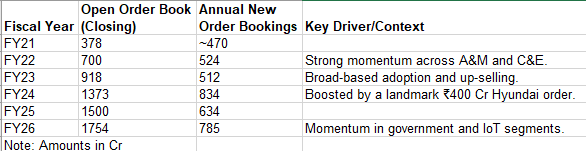
7. Order Book Evolution:
a. Year-on-Year Order Book Performance
- Management tracks the Open Order Book to Revenue conversion ratio, which historically spans 3 to 5 years.
- Conversion Rates: The percentage of the opening order book converted into revenue within a single year was approximately 21% in FY22 but dropped to around 13% by FY25. It showed recovery in FY26, picking back up to 17-18%
- Lumpiness: Management emphasizes that the order book is “lumpy” because automotive OEMs do not decide on new models every quarter, and government contracts often have milestone-based billing
- MapmyIndia’s order book has shown consistent growth since its listing, evolving from an open order book of ₹377.5 Cr in FY21 to ₹1,754.4 Cr in FY26, representing a 36% CAGR over that 5-year period.
- The following table summarizes the evolution of the order book and new bookings based on the public filings:
b. Unique Selling Propositions (USPs)
MapmyIndia’s ability to win and retain orders year after year is based on several core differentiators:
- Unrivalled Proprietary Data: They possess India’s most comprehensive and accurate digital map database, built over 25+ years. This includes address-level detail, 3.1 crore+ places, and 40 crore+ geo-referenced photos and panoramas—an asset management describes as “difficult to replicate”.
- Favourable Regulatory Environment: Indian geospatial guidelines restrict foreign entities from ground surveys or using granular geospatial data. As an indigenous entity, MapmyIndia is the preferred supplier for critical infrastructure, government, and defence projects.
- Vertical Integration (Full-Stack): They offer a “one-stop-shop” stack ranging from map data to APIs, software, and IoT hardware. This vertically integrated system provides full control over solutions and mitigates pricing pressure.
- Continuous Innovation: MapmyIndia has a history of out-innovating global peers in the Indian context, launching the country’s first internet mapping portal and being an early mover in 4D and HD mapping.
- High Retention and Predictability: The company signs long-term (3 to 5 years), mutually renewable contracts that provide high revenue predictability and deep customer synergy
II: Management
1. About
- The leadership at MapmyIndia is characterized by a “founder-heavy” structure. The business was founded in 1995 by Rakesh Kumar Verma (CMD) and Rashmi Verma (CTO), who pioneered digital mapping in India when the space was highly regulated
- Rakesh Verma brings over 50 years of professional experience, including a decade in the U.S. at EDS (General Motors).
- Rashmi Verma, a B.Tech from IIT Roorkee, has over 40 years of experience and remains the technical architect of the firm.
- The generational transition is well underway with Rohan Verma (CEO), who has been with the business for over 20 years. A Stanford electrical engineer and London Business School alumnus, he joined the board in 2007.
- Beyond the family, the “home-grown” leadership includes Sapna Ahuja (COO), who joined as a trainee in 2004 and rose through the ranks over 17+ years.
- Anuj Jain (CFO) and Nikhil Kumar (President, Geospatial) further bolster the core team with 13+ and 30+ years of domain experience respectively.
Note: This level of continuity is rare in deep-tech and provides a stable foundation for long-term IP creation.
2. Business Philosophy and Remuneration
- Their philosophy is centred on an asset-light, high-operating-leverage model where proprietary data is created once and licensed many times through MaaS, SaaS, and PaaS.
- Regarding remuneration, the company follows a structured policy designed for a high-performance culture. Noteworthy points:
- The ratio of CEO Rohan Verma’s remuneration to the median employee salary was 118:1 in FY22, though this moderated to 52.6:1 by FY23.
- In several years (FY22, FY23), there was no increase in managerial remuneration even as the average employee salary rose by 7.5% to 12%.
- Rohan Verma’s compensation is partially tied to performance-linked incentives, but ESOPs are strictly reserved for the broader employee base and not the directors.
3. Shareholding and Equity Discipline
- The company exhibits high equity discipline, having raised only ₹124 crores in its entire history before going public.
- The Verma family maintains a tight grip, with promoter holding consistently around 51.4% to 53.7%.
- The primary objective is stated as maximizing shareholder value while ensuring business continuity through organic cash flow generation.
- The company has avoided dilutive equity raises, preferring to fund growth through its own accruals.
3. Minority Shareholders Reward and Cash Allocation
- Management’s strategy for its substantial cash pile (reaching ₹685 Cr including investments by May 2026) has been a point of debate. Rakesh Verma has explicitly prioritized organic growth and working capital over aggressive buybacks.
- Cash is primarily deployed into R&D (approx. 4.5% of sales) and supporting the working capital-heavy government business handled by the Mappls DT subsidiary.
- Selective inorganic moves include the acquisition of Gtropy (to scale IoT) and Indrones (for drone solutions), both funded through internal reserves.
- While they reinvest the majority of profits, they maintain a consistent dividend payout (e.g., ₹3.50 per share in FY24 and FY26) as a gesture of gratitude. A dedicated Investment Management Committee meets fortnightly to optimize treasury returns, with over 80-90% of the portfolio in AA-rated or higher instruments.
4. Financial Efficiency and Governance
a. Financial Efficiency
- The business maintains industry-leading return ratios, though they have seen some volatility due to recent government business delays.
- Return on Equity (ROE): Has generally stabilized between 20% and 22.4%.
- Return on Capital Employed (Operating ROCE ex-Cash): This is the “star” metric, peaking at 122% in FY23. However, it dropped to 59% in FY26. FY26 dip was a deliberate choice. Management deployed ₹120 crores into organic growth, specifically stocking up on IoT hardware inventory and supporting government receivables, which they view as “investing for future revenue” rather than a loss of efficiency.
b. Disclosures and Communication
- Communication is professional but marked by a “management knows best” tone regarding quarterly volatility.
- They frequently caution analysts that quarterly numbers can be lumpy and misleading due to milestone-based billing, urging a focus on Year-on-Year (YoY) or Year-to-Date (YTD) metrics.
- In a rare move of self-reflection in May 2026, Rakesh Verma admitted that their existing reporting categories (A&M and C&E) were confusing to both analysts and themselves. Consequently, they decided to revise their segmental reporting to be more aligned with their target markets: Auto, Government, and Corporate.
- They have been candid about the Days Sales Outstanding (DSO) challenges in the government sector, noting that while the receivables are high (94 days), they have almost zero bad debt.
- Management provides detailed quarterly presentations and has shown a willingness to engage in granular discussions, though they occasionally defer specific customer-level questions for private follow-ups to maintain competitive confidentiality.
III: Insights From Financial Statements
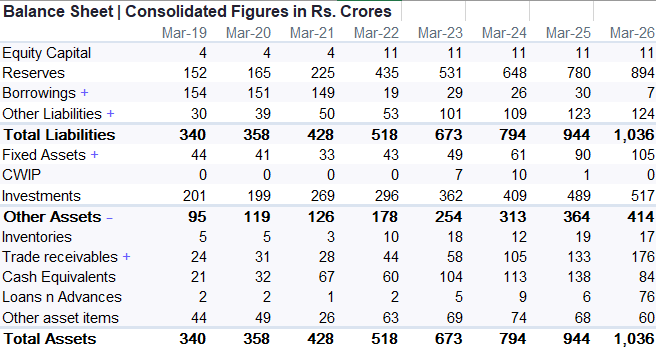
1. Balance Sheet: Strong
- An asset-light, deep-tech business that is increasingly using its massive capital reserves to finance its transition into a hardware-enabled, government-partner integrator.
- Equity capital has remained static at ₹11 Cr since the 2022 listing, but the Reserves have ballooned from ₹152 Cr in 2019 to ₹894 Cr in March 2026. This represents a steady compounding of retained earnings, proving the business’ steady profitability.
- The company is effectively debt-free.
- Fixed Assets: Fixed assets have grown from ₹44 Cr to ₹105 Cr. It reflects the deployment of IoT devices on rent and sophisticated map survey vehicles.
- Investments amount to ₹517 Cr. Combined with cash equivalents, the company has a ₹685 Cr liquidity pile. Management has been conservative, keeping 80-90% of this in high-quality debt and InvITs to shield from equity market volatility while waiting for the right M&A or organic growth opportunity.
- Receivables have surged from ₹28 Cr in 2021 to ₹176 Cr in 2026. This is the clearest sign of the company’s deepening involvement in government and defence contracts via the Mappls DT subsidiary. While management maintains there is “zero bad debt,” the rising Days Sales Outstanding (DSO) to 94+ days is a structural shift.
- Inventories: Ignorable.
- Loans and Advances: A notable spike to ₹76 Cr in March 2026. This likely reflects mobilization advances or security deposits required for the large-scale government infrastructure projects that now dominate the ₹1,750+ Cr order book.
Source: Screener.in
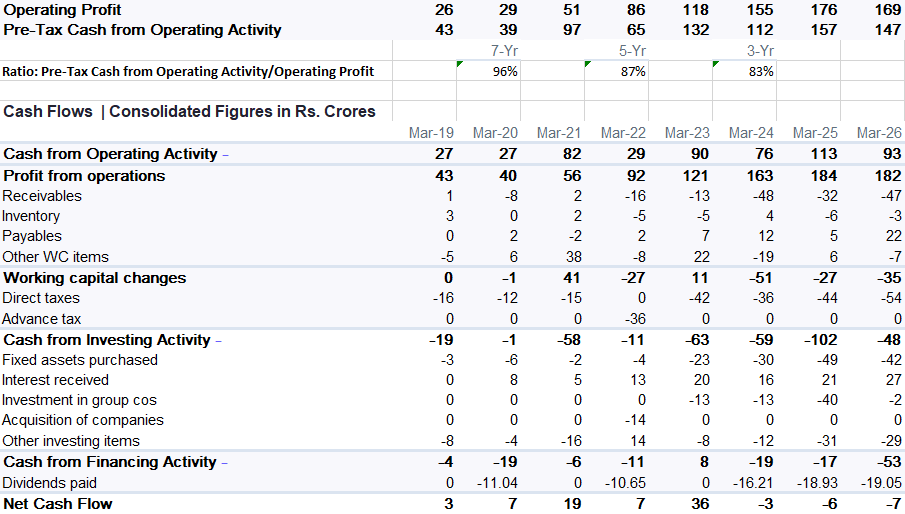
2. Cash flow: Self-Sustaining
- The ratio of Pre-Tax cash from operating activities to operating profit varies from 83% to 96% on a time-frame of 3, 5 and 7 years. This shows that the operating profits are real as they are actually resulting in cash in-flows.
- However, receivable in recent times has cash outflows of ₹48 Cr in 2024 and ₹47 Cr in 2026, making the business “Working Capital” intensive with time, most likely due to government and defence projects.
- Consistent Dividends: Financing outflows are dominated by Dividends Paid, which have scaled from ₹10.6 Cr in 2022 to ₹19.05 Cr in 2026. This matches their stated policy of rewarding “loyal shareholders” with consistent payouts even while holding cash for organic growth.
Source: Screener.in and RA’s Inferences
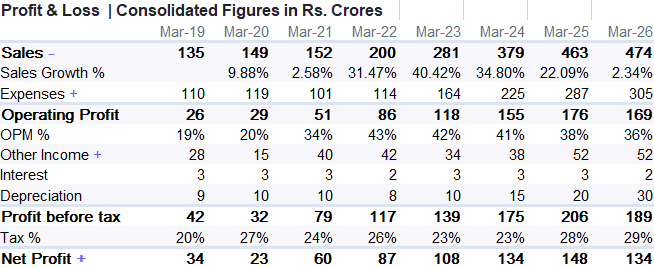
3. Profit and Loss: Operating Leverage
- The revenue trajectory from March 2019 (₹135 Cr) to March 2026 (₹474 Cr) reflects a healthy long-term compounding story, but the Sales Growth % line exposes the “lumpy” reality management often cautions about. After a stellar expansion in FY23 (40.42%) and FY24 (34.80%), growth crashed to a mere 2.34% in FY26.
- Segmental Drag: Primarily driven by the C&E segment, which saw a 3% decline in FY26 due to significant “deferments” and “delays” in government and defence contracts.
- Operating Margins: The Operating Profit Margin (OPM %) is perhaps the most scrutinized line item for this firm. We saw a massive expansion from 19% in 2019 to a peak of 43% in 2022, followed by a gradual moderation to 36% by March 2026.
- Mix Shift Impact: This compression isn’t necessarily a loss of pricing power but a change in the revenue mix. The Map-led business remains a cash cow with 50%+ EBITDA margins, but the rapid scaling of the IoT-led business (growing 91% in FY24) initially acted as a drag due to lower-margin hardware sales.
- Operating Leverage: Management’s “J-Curve” thesis-where hardware seeds future high-margin SaaS-bore fruit in Q4 FY26, as IoT margins spiked to a “stellar” 33% due to improved SaaS contribution (66% of IoT revenue).
- Other Income: This has become a structural pillar of the P&L, rising to ₹52 Cr by FY26. It represents the yield on a ₹685 Cr cash and investment pile.
- The Net Profit (PAT) has compounded from ₹34 Cr to ₹134 Cr, but the growth has recently “softened” alongside the top line.
- The PAT Lag: Analysts have rightly flagged the “delta” where PAT growth (e.g., 25% in FY24) frequently lags revenue growth (35%). Management acknowledges they need to bring these more “in sync” as the high-margin Map-led and SaaS streams dominate the mix.
Source: Screener.in
IV: Risks and Concerns:
It’s a business dealing with the growing pains of scale, particularly in its interaction with the public sector and the shifting dynamics of its order book.
1. Operational Risks:
- The operational core of the business remains its digital map database and software platforms. Any disruption here is catastrophic, not just a nuisance.
- Infrastructure Vulnerability: Management candidly admits that while they continue to devote resources, their operations are dependent on IT systems that may not be adequately supported by a robust business continuity plan. This is a significant admission for a deep-tech firm, implying that a major disaster could seriously impact business continuity.
- Mitigation through Insurance: To counter this, they have secured substantial coverage, including ₹50 crores in professional indemnity and ₹60 crores in Directors & Officers (D&O) insurance.
- Cybersecurity and Data Privacy: While the company reported zero data breaches and zero incidents involving personally identifiable information in FY25, they have instituted stricter data categorization and labelling to mitigate the “digital compromise” risk inherent in an entirely digital business model.
2. Financial Risks:
- The primary financial concern is the deterioration of the cash conversion cycle and credit risk.
- Receivables and DSO: The most glaring data point is the spike in Days Sales Outstanding (DSO), which reached 94 days in FY25. This reflects the “lumpy” nature of government contracts where payments are secure but chronically delayed.
- Rising Provisions: The provision for bad and doubtful debts nearly doubled from ₹2.68 crores in FY24 to ₹5.82 crores in FY25. While management views credit risk as “minimal” due to the marquee nature of their clients, the rising trend in provisions suggests a need for closer monitoring of their enterprise and government collections.
- Treasury Management: To shield their surplus funds from market volatility, the company has pivoted toward longer-term instruments like InvITs and high-quality fixed income (80-90% AA-rated or higher) to optimize returns on their ₹659.9 Cr cash and investment balance.
3. Regulatory and Statutory Risks:
- MapmyIndia’s business model is fundamentally protected by a “regulatory wall.”
- The Geospatial Advantage: The Geospatial Guidelines of 2021 and the 2022 Deregulation Bill remain their greatest structural advantage, restricting foreign entities from conducting granular ground surveys and favouring indigenous players for sensitive government and defence projects.
- Compliance Complexity: As they expand internationally (e.g., the PT Terra Link JV in Indonesia), they face a “compliance risk” involving the legal and taxation legislation of multiple new jurisdictions.
- Statutory Compliance: The company remains compliant with all environmental laws (Water/Air Pollution Acts) and has reported no fines or penalties from regulators or judicial institutions regarding corruption or conflicts of interest in FY25.
4. Valuation and Execution Risks: The Guidance Gap
- The Guidance Gap weights on business valuations: Management announced ambitious target of ₹1,000 crore revenue by F27/28. However, they not in a position to commit that how much of their opening order book of ₹1,754.4 Cr. can be converted to revenue and by what timeline. Also, the announced opening order book has 18% GST component, which doesn’t reflect in revenue.
- Order Book Conversion Crash: A major red flag emerged in FY25 when the revenue conversion from the open order book dropped to 13%, down from 21-22% in previous years. Management explains this as “pushouts” of large projects rather than lost business, but it creates massive uncertainty for quarterly forecasting.
- Execution in Government Projects: Many government orders were delayed in FY25-26, leading to “muted growth” (only 2.34% annual revenue growth in FY26). If these “deferred” orders do not materialize in FY27, the path to the ₹1,000 crore revenue target becomes mathematically improbable.
- High Growth Hurdle: To reach their FY28 milestone, the company needs to maintain a 35-40% CAGR. Given the recent softening in momentum, execution risk is currently at its highest since the IPO, requiring the opening order book of ₹1,754.4 Cr to convert at a much higher velocity than the 18% seen recently.
V: Miscellaneous
1. Contingent Liabilities: Insignificant
The contingent liability profile shows a notable expansion, primarily driven by the company’s increasing engagement in large-scale projects.
- Performance Guarantees: Outstanding bank guarantees climbed to ₹2,904 lakhs in FY25, a 32% jump from the ₹2,195 lakhs reported in the previous year. While these are standard for business operations, the growth reflects the “lumpier” nature of recent contract wins.
- The IPO Legacy: A specific ₹740 lakh bank guarantee issued to the Bombay Stock Exchange in 2021-22 remains stuck in limbo. Management is still waiting for the final settlement of all vendor claims related to the IPO offer-for-sale before this capital is released.
- The Retroactive Regulatory Risk: An opaque risk involves a Supreme Court ruling regarding provident fund contributions for India-based employees. Management continues to maintain that calculating this liability is “impracticable” due to significant uncertainty over whether the government will apply the ruling retroactively. Consequently, no provision has been made, but it remains a monitorable “off-balance sheet” cloud.
2. Retirement Liabilities: Insignificant
- Gratuity Funding Status: On a consolidated basis, the Present Value of Obligation (PVO) reached ₹2,123 lakhs. While plan assets (managed via Kotak Life Insurance) rose to ₹940 lakhs, the net liability recognized on the balance sheet jumped to ₹1,183 lakhs, up from ₹903 lakhs in FY24.
- Salary Growth Assumptions: Management is underwriting these liabilities with a 12% long-term rate of compensation increase, which is aggressive but realistic given the high-stakes battle for deep-tech talent in India.
- Actuarial Volatility: The discount rate used for valuation moderated slightly to 7.04% (from 7.25%), contributing to the upward pressure on the PVO (Present Value Obligation). Additionally, the maturity profile shows that over ₹1,090 lakhs of the consolidated obligation is due beyond five years, providing some breathing room for cash flows.
3. Performance of Subsidiaries and Associates: Insignificant
- Mappls DT (Domestic Defence/Govt): This is currently the star performer among subsidiaries, contributing ₹272 lakhs to the consolidated profit (a 1.81% share). Its total asset base of ₹2,448 lakhs highlights its role as the primary vehicle for government digital transformation.
- Gtropy Systems (IoT): The IoT arm remains profitable, adding ₹167 lakhs to the group’s bottom line in FY25.
- International and JV Drags: The USA subsidiary, CE Info Systems International Inc., remains a minor drag with a loss of ₹58 lakhs. More significantly, the new Indonesia JV, PT Terra Link Technologies, reported a loss of ₹282 lakhs for the brief period between its December 2024 launch and March 2025.
- Strategic De-risking: A key detective find is the board’s decision in FY25 to stop further investment in Kogo Tech Labs. Despite holding a 40.17% stake, management appears to be capping its exposure to this associate, which lost ₹109 lakhs during the year.
4. Related Party Transactions (RPTs): Monitor the trajectory
- The ₹150 Crore Gtropy Mandate: Shareholders were asked to approve a massive ₹150 crore limit for transactions with Gtropy Systems for FY26. This represents over 32% of the company’s audited consolidated turnover, signalling that the IoT “J-curve” is being heavily fuelled by internal procurement and service sharing.
- International Revenue Flow: For the first time, PT Terra Link Technologies emerged as a significant related party customer, with MapmyIndia recording ₹2,368 lakhs in service sales to the JV in FY25.
- Director-Level Governance: The company continues to utilize the expertise of Ms. Rakhi Prasad (Non-Executive Director) for data analytics product development, with an approved professional fee limit of ₹1.75 crores.
- Common Director Entities: Transactions with ClarityX Analytics (₹240 lakhs for support services) and a proposed ₹12 crore purchase limit from Zenithra Tech indicate a continued reliance on a tight-knit circle of affiliated entities for specialized technical support.
5. Research Sources
- Company’s website and exchange filings
- Screener.in
Public Appearance Disclosures: I, Surender Singh (Proprietor My Equity Sherpa), am a SEBI registered research analyst (INH000026035). I hereby disclose that:
1. Neither I, nor my family members, have any financial interest in the subject company at the time of this publication.
2. Neither I nor my family members or associates hold actual or beneficial ownership of one per cent. or more securities of the subject company, measured at the end of the month immediately preceding this disclosure.
3. Neither I nor my family members or associates have any other material conflict of interest relating to the subject company at the time of this publication.
4. Neither I nor my associates have received any compensation from the subject company in the past twelve months.
5. Furthermore, neither I nor my associates have received any compensation for investment banking, merchant banking, or brokerage services from the subject company in the past twelve months. I have also not received any compensation or other benefits from the subject company or a third party in connection with this analysis.
Leave a Reply